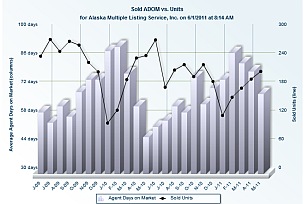
Anchorage Market Statistics
How Much Does A Home Cost Today in Anchorage?
Rod Stone 907-727-9379
Chart Prepared 04/01/2011
Year |
# Sold |
Avg. List Price |
% List Price |
Avg. Sold Price |
% Sold Price |
Avg. DOM |
2001 |
3302 |
$208,462 |
NA |
$207,120 |
NA |
52 |
2002 |
3175 |
$223,356 |
6.67% |
$222,522 |
6.92% |
48 |
2003 |
3328 |
$237,374 |
5.91% |
$235,916 |
5.68% |
49 |
2004 |
3337 |
$261,726 |
9.30% |
$259,856 |
9.21% |
45 |
2005 |
3272 |
$294,065 |
11.00% |
$292,352 |
11.12% |
40 |
2006 |
3069 |
$318,201 |
7.59% |
$315,523 |
7.34% |
44 |
2007 |
2762 |
$332,319 |
4.25% |
$327,069 |
3.53% |
64 |
2008 |
2498 |
$332,127 |
-0.06% |
$325,921 |
-0.35% |
72 |
2009 |
2449 |
$325,906 |
-1.91% |
$321,025 |
-1.53% |
65 |
2010 |
2298 |
$334,807 |
2.66% |
$328,922 |
2.40% |
64 |
This information tells us that we are in a “Sellers Market” or “Buyers Market” or somewhere in between. With this information in hand we fashion together our game plan, a game plan that will assist you in achieving your stated goals!
